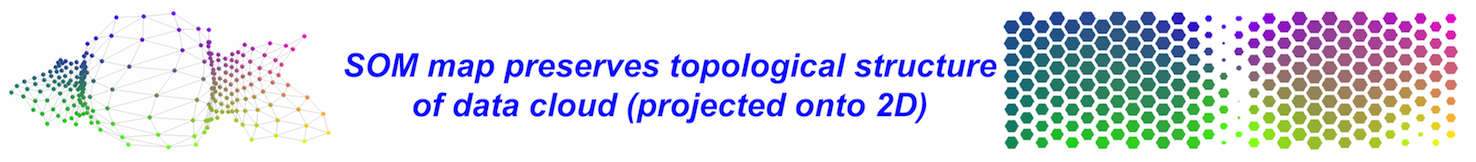
Topology-Preserving Selection and Clustering (TPSC)
GO TO ➢ [ Summary · Vector Space Model · SOM · SVD ] ➢ [ Hybrid SOM-SVD · Two-Phase Clustering ] ➢ [ HOWTO ] ➢ [ Citations ]
How To
This document describes how to use MATLAB PACKAGE to realize the implementation of topology-preserving gene selection and clustering, and is organized into the following three sections:
- 1: System requirements - explanation of operating systems required for computing environment
- 2: Protocol outline - general recipe for the analysis flow
- 3: Intuitive demo - illustration of the proposed methodology by processing genome-scale expression data of human cells during various stress responses
1: System requirements
We assume you have installed MATLAB version 6.5 (R13) or later in one of three Operating Systems (i.e., Windows OS, Linux/Unix, and Mac OS). Up to now, we have already tested MATLAB PACKAGE in these three OSs. To quick start, please follow step-by-step procedures in "main_Tutorials.m" using command lines at MATLAB prompt. To expand the utility of this automated approach in bioscience research, any comment or feedback (via Email) will be greatly appreciated!
2: Protocol outline
➢ Step 1: Non-linear transformation of primary gene expression data (gene expression matrix as input) into output codebook matrix using SOM with EP kernel function;
➢ Step 2: Linear decomposition of the resulting codebook matrix by SVD;
➢ Step 3: Calculation of distance statistic for each node, following dominant eigennode selection and SVD subspace projection;
➢ Step 4: Using FDR multiple comparison procedure for significant node assessment and subsequent gene selection;
➢ Step 5: Two-phase gene clustering of selected genes through SOM-based methods, including the selected gene expression matrix trained by SOM with Gaussian kernel function (1st phase) and distance matrix based clustering of SOM (2nd phase).
3: Intuitive Demo
Purpose: Illustration of the proposed methodology by processing genome-scale expression data of human cells during various stress responses (Murray et al. 2004)
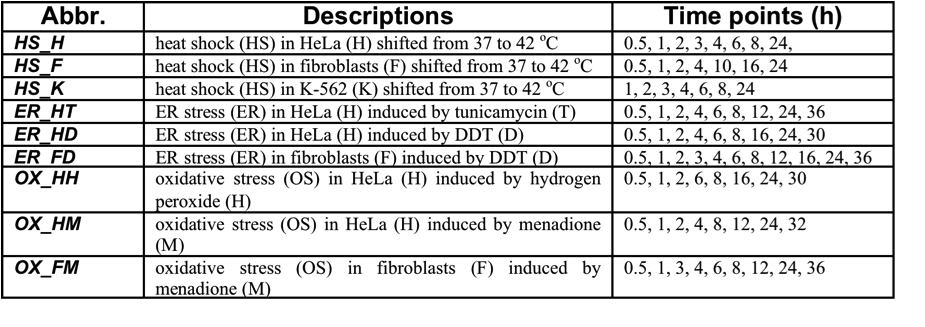
Data: Generated by cDNA microarray containing over 40,000 cDNA elements, representing 25,802 genes; primary gene expression (36,164 genes×76 samples), after preliminary clean-up procedures including transformation relative to zero time point for each time course by subtracting the median log2 expression ratios in the time-zero replicates, and exclusion of those with missing values more than 40%, and finally excluding samples at zero time points for follow-up. Details of stress conditions can be referred to Table 1.
Table 1. Details of stress conditions for human expression data during various stress responses
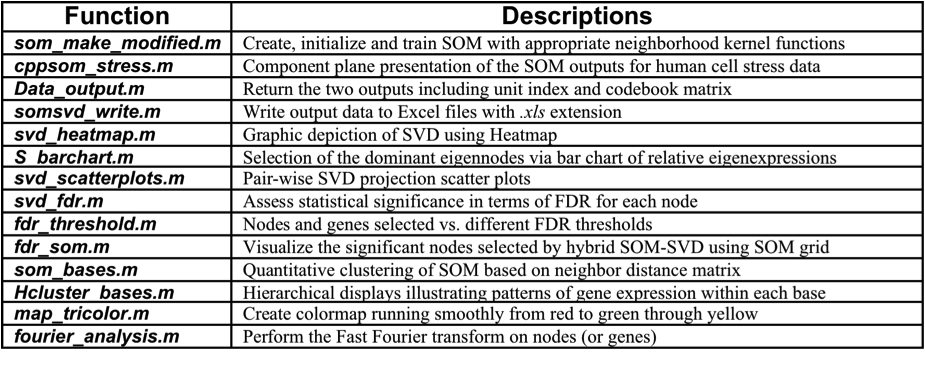
Matlab package: It can be found in a directory "Matlab packages" after downloading and uncompressing Matlab Package.tar.gz, which contains 1) a subdirectory named "somsvd" (Table 2); 2) a subdirectory called "somtoolbox", which is backbone for SOM training and visualization, downloaded from SOM Toolbox; 3) a subdirectory "microarray_db" for the storage of microarray data; 4) a file called "main_Tutorials.m", giving the step-by-step instructions how to take advantage of the package to analyze the data above, and thus other microarray data of interest.
Table 2. Description of functions in "somsvd" subdirectory
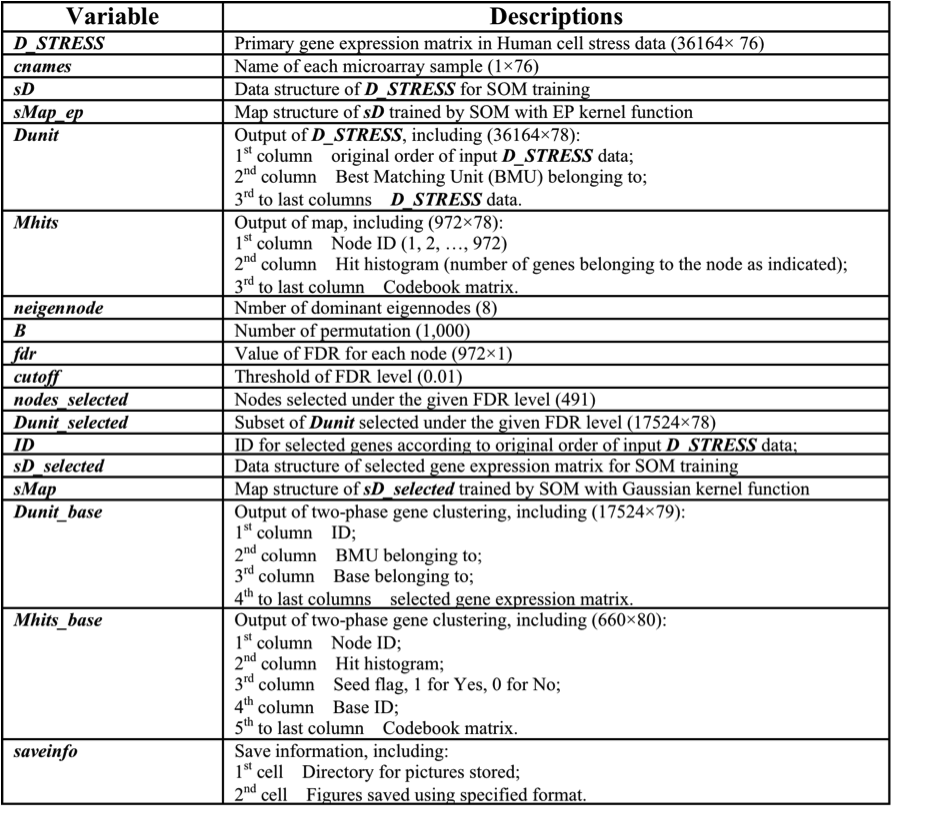
Results: See Table 3 for description of MATLAB variables in the Workspace. Besides, four variables (Dunit, Mhits, Dunit_base and Mhits_base) are exported into files ("Dunit.xls", "Mhits.xls", "Dunit_base.xls" and "Mhits_base"); A new subdirectory is created for storing hierarchical displays with each of obtained bases/clusters.
Table 3. Description of MATLAB Variables in the Workspace
Intuitive steps: Illustrate the proposed methodology, together with resultant images below.
|
Step 1:
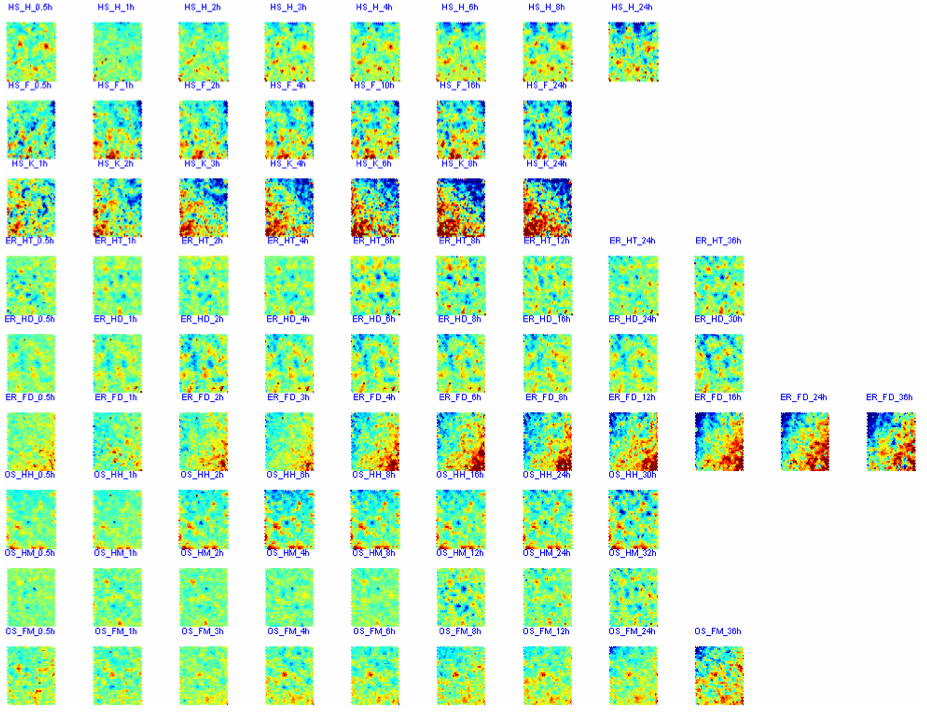
Non-linear transformation of primary gene expression data into output codebook matrix using SOM with EP kernel function (som_make_modified.m)
CPPs of SOM outputs (cppsom_stress.m)
|
|
|
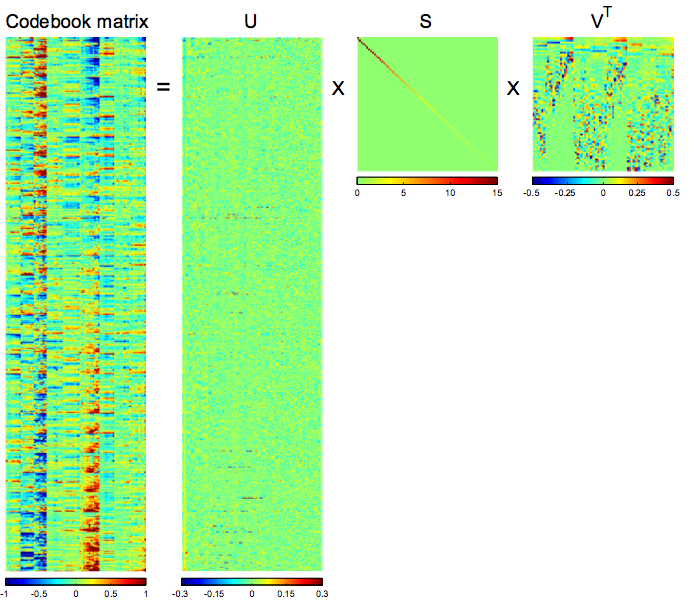
Step 2:
Linear decomposition of the resulting codebook matrix by SVD (svd_heatmap.m)
|
|
Step 3:
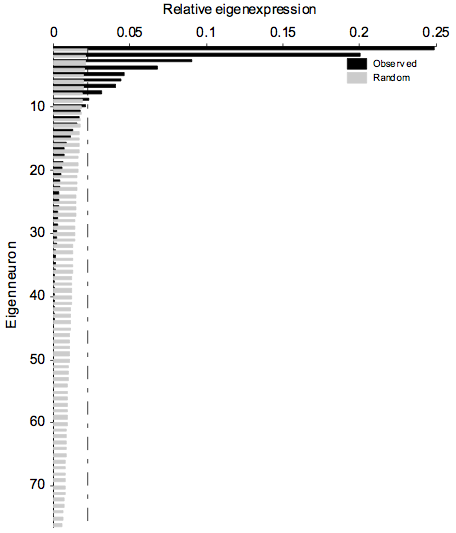
Calculation of distance statistic for each node, following dominant eigennode selection and SVD subspace projection
Barchart for S and estimation of the number of significant eigennodes (S_barchart.m)
|
|
|
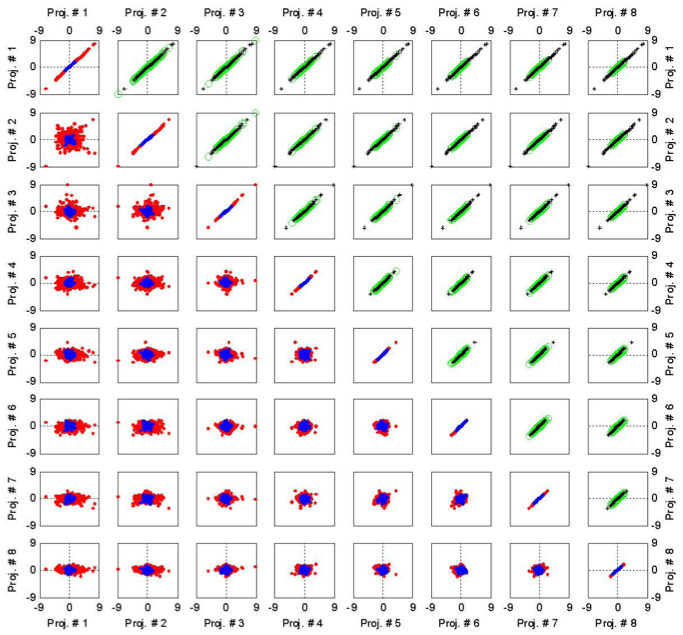
Pair-wise SVD projection scatter plots (svd_scatterplots.m)
|
|
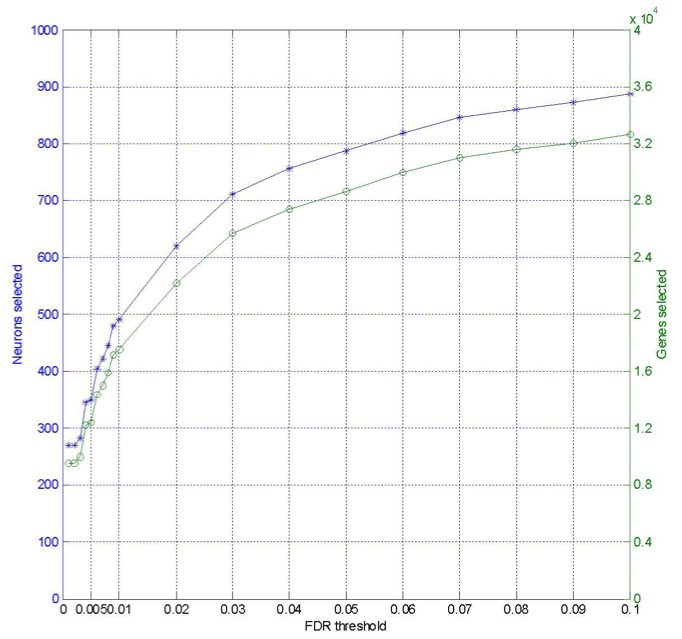
Step 4:
Using FDR multiple comparison procedure for significant node assessment and subsequent gene selection (svd_fdr.m)
The number of nodes and genes selected under indicated FDR threshold (fdr_threshold.m)
|
|
|
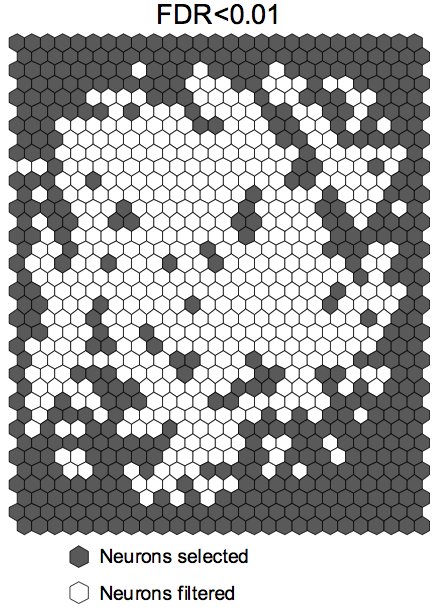
Visualize the nodes selected under indicated FDR using SOM (fdr_som.m)
|
|
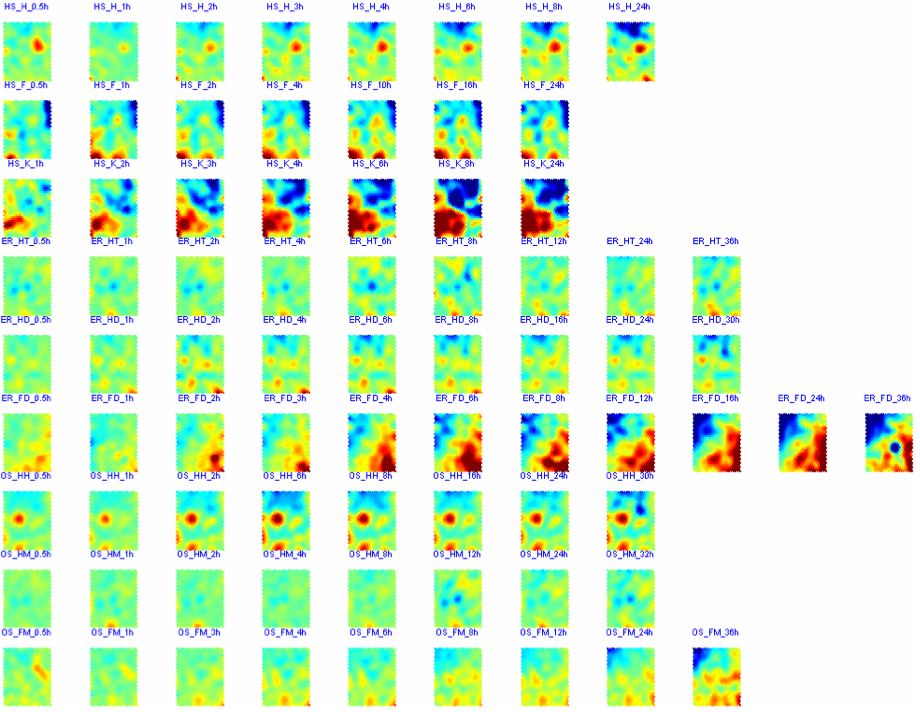
Step 5:
Two-phase gene clustering of selected genes through SOM-based methods, including the selected gene expression matrix trained by SOM with Gaussian kernel function (1st phase) and distance matrix based clustering of SOM (2nd phase)
CPPs of SOM outputs (cppsom_stress.m)
|
|
|
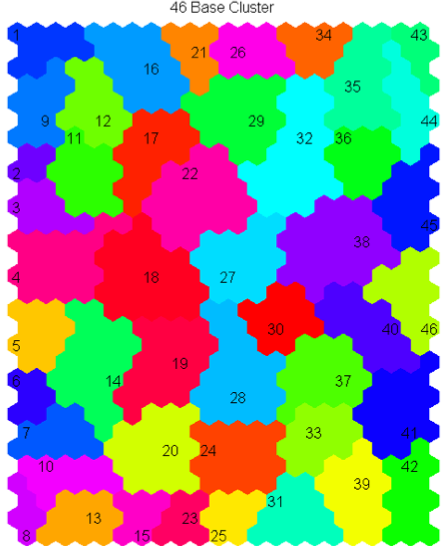
Quantitative clustering of SOM based on neighbor distance matrix (som_bases.m)
|
|