Automated Map Reading: Image based localisation in 2-D maps using binary semantic descriptors
Pilailuck Panphattarasap and Andrew Calway
We investigate techniques for linking images to 2-D cartographic maps. Given an image taken within an urban environment, say, we want to determine where the image was taken on a 2-D map. This is an intriguing problem, not least because it is something that humans do well, albeit with varying degrees of ability. Very often people will refer to a pictorial map to work out where they are based upon what they see around them. Of course, the advent of GPS and applications such as Google Maps means that localisation has been automated, but this relies on an external infrastructure and is also within a highly metric framework, defined in terms of coordinates and physical distances. In contrast, humans appear to relate to places and location using visual semantics (go down the road and turn left), and so one of the aims of this work is to make progress in linking visual data to those forms of description and representation.
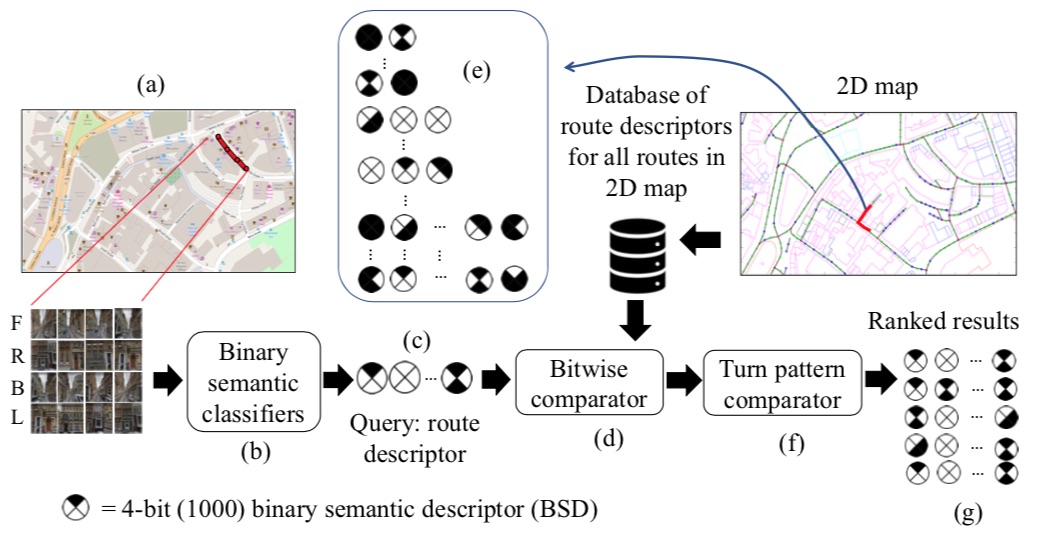
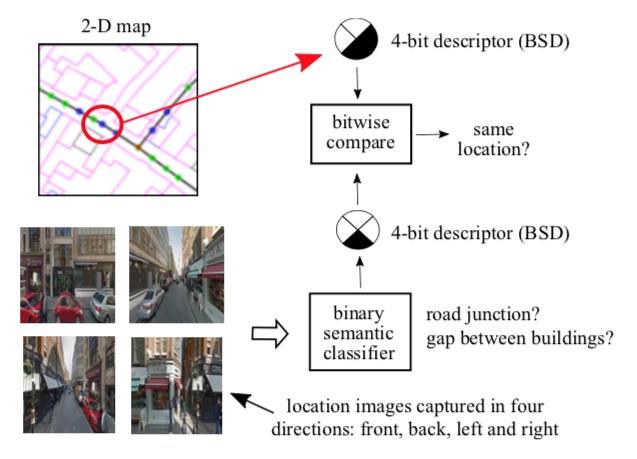
Binary Semantic Descriptors (BSD). A key element of the work is the representation of individual places. This is based on a simple binary descriptor indicating the presence or otherwise of semantic features. In this initial exploratory work we opted to use two such features: gaps between buildings and road junctions. Both are ubiquitous in urban environments and importantly, can be extracted from many forms of 2-D maps. It also turns out that with suitable training data classifiers can be built to detect the presence of such features in images. As indicated above, we represent a given place by a 4-bit descriptor, indicating the presence (1) or otherwise (0) of a junction in the forwarded and backward directions and a building gaps in the left and right directions. Descriptors can readily be extracted from a vectorised 2-D map (we use OpenStreetMap (OSM)) and estimated from images taken in each direction using binary classifiers (see below). We call these binary semantic descriptors (BSD).
Not surprisingly, such descriptors are not sufficiently discriminative to identify an individual location - many locations will have similar BSDs. This leads to the second key element of our approach. It turns out that if BSDs are computed sequentially along a route (we used regular intervals with approximately 10m spacing), then the binary pattern created by concatenating the BSDs quickly becomes very discriminative. In our case this reflects the fact that the pattern of gaps between buildings and presence of junctions becomes more unique as a route is extended, leading to a unique representation once a certain route length is reached. On average we found this to be around 200m. As illustrated above, such route BSDs are basis of our localisation algorithm - 360 degree images are collected at regular intervals along a route and the concatenation of the BSDs estimated from binary classfiers is compared with groundtruth route BSDs computed from a vectorised 2-D map to give localisation.
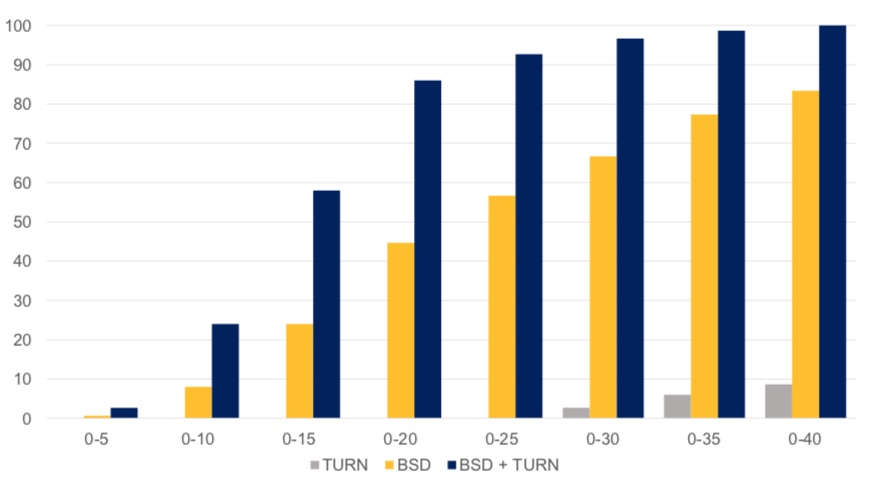
We evaluated the approach using Google Streetview image data and OSM 2-D maps. Full details can be found in the publication given above. In summary, as the graph below illustrates, we found that for a typical urban environment over 80% successful localisation can be achieved after approximately 400m using route BSDs alone and after 200m when combining route BSDs with turn information (left or right turn patterns along a route - note that turn patterns alone provided very little localisation information). An example of successful localisation can be scene in the video, where the orange circle indicates the groundtruth location and the changing colours indicate estimates of location certainty, with red representing high certainty. Note that once localisation is confirmed, then the route length can be fixed and the successful additioon/removal of BSds enables localisation to continue in real-time.
Accuracy of localisation (% of correctly identified routes) versus route length using turn patterns (grey), route descriptors (yellow), and route descriptors with turn patterns (blue).
Example of successful localisation using route BSDs and turn patterns. The orange circle indicates the groundtruth location and the changing colours indicate the certainty of location on the 2-D map, with red being high. Below the map are shown the images collected at each location (from GSV), the groundtruth BSDs from the OSM data, the BSDs estimated from the images using binary classifiers (~75% classification accuracy) and the best matching BSDs from OSM with associated images from GSV. Note that once localisation is confirmed, a fixed length route is used and tracking proceeds in real-time with BSds being added/removed from the route pattern.
 We investigate techniques for linking images to 2-D cartographic maps. Given an image taken within an urban environment, say, we want to determine where the image was taken on a 2-D map. This is an intriguing problem, not least because it is something that humans do well, albeit with varying degrees of ability. Very often people will refer to a pictorial map to work out where they are based upon what they see around them. Of course, the advent of GPS and applications such as Google Maps means that localisation has been automated, but this relies on an external infrastructure and is also within a highly metric framework, defined in terms of coordinates and physical distances. In contrast, humans appear to relate to places and location using visual semantics (go down the road and turn left), and so one of the aims of this work is to make progress in linking visual data to those forms of description and representation.